
WHITE PAPER: Why Are Some Police and Fire Departments “Better”?
Regionalism Drill Down White Paper #6
by David Rusk
Special to ConstructForSTL
Editor’s Note: David Rusk will be returning to St. Louis to speak in front of Construction Forum STL on Wednesday, June 12th. His topic will be “STL Regionalism: What NOW?” Click here for more information and to register for this free event.
“Which police department do you think serves its citizens best right now? Kirkwood or the City? Clayton or the City? Florissant or the City? … You’d be hard pressed to find many folks who would say that the hulking, scandal-ridden St. Louis Metropolitan Police Department is the winner. So, do you think that a still larger bureaucracy – with no provision for a civilian review board, by the way – is the answer?”
— Ray Hartmann, “Better Together Has Zero Facts to Back Up Its Most Crucial Claims,” in Riverfront Times, March 13, 2019.
Merging the St. Louis Metropolitan Police Department, St. Louis County Police Department and all 55 suburban police departments into one was the centerpiece of the Better Together plan to create a Metropolitan City of St. Louis.
Columnist Ray Hartmann’s question caused me immediately to think of a seminal study of a generation ago: America’s Ailing Cities: Fiscal Health and the Design of Urban Policy by Profs. Helen F. Ladd of Duke University and John Yinger of Syracuse University.
Ladd and Yinger carried out a rigorous statistical analysis of the fiscal health of 86 central cities over two decades. They concluded that
“a city’s fiscal health … depends on economic, social, and institutional factors that are largely outside the city’s control. Poor fiscal health is not caused by poor management, corruption or profligate spending, and a city’s ability to alter the city’s fiscal health is severely limited. Moreover, poor fiscal health implies that a city must accept a higher-than-average tax burden to provide average quality services or, alternatively, it must accept lower-than-average services quality to have an average tax burden…. [T]he policy tools available to city officials are weak compared to the impact on city finances of national economic, social, and fiscal trends.”
Most intriguing were their findings on the costs of police and fire services. For police services a city’s poverty rate was the single greatest influence; for every one percent increase in the poverty rate, a city’s cost for police services per resident, on average, increased 5.5 percent. In other words, if City A’s poverty rate was 22 percent, and city B’s poverty rate was 2 percent, one would expect that City A’s cost of police services per resident would be over twice that of City B’s.
Somewhat surprisingly, the poverty rate was also the greatest single factor affecting the cost of fire services per resident, even more than the proportion of older housing (though poverty and older housing tend to be closely related); for every one percent increase in the poverty rate, a city’s cost for fire services per resident, on average, would increase by 4.2 percent.
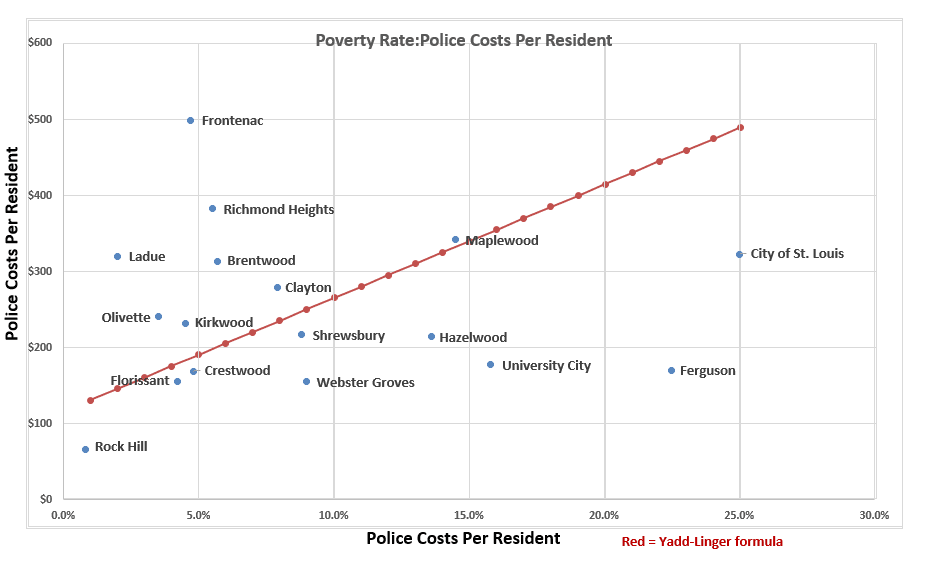
I’ve tested the Ladd-Yinger formula against the cost of police and fire services for St. Louis City and the 18 county municipalities that support both professional police and fire departments. (I also added Florissant, the county’s most populous city, which is served by an independent fire district but has a professional police department.)
Compiling economic and population data from the Census Bureau’s American Community Survey 2018 was easy.
However, compiling police and fire services budgets from their on-line FY 2019 budget documents (all but Frontenac FY 2016), Maplewood FY 2017, and Shrewsbury FY 2018) was a different story. Practices vary greatly, particularly in their differing treatment of pension costs and capital outlay.
So, having gone through every city’s on-line budget documents three times, I concluded that only by comparing simple salary costs – that is, wages and salaries but no benefits – for police officers and firefighter/EMS personnel would produce apples-to-apples comparisons. Or rather, Granny Smith-apples-to-Golden-Delicious-apples for many departments run 911 communications and dispatch centers internally while eight cities, for example, contract this function out to the East Central Dispatch Center.
Chart 1 shows the relationship between poverty rates and police cost per resident among our 18 St. Louis area cities (excluding Berkley, Des Peres, and Glendale for incompatible data).
If the Ladd-Yinger finding held true for St. Louis City and these 16 smaller, suburban cities, the data points would fall close to the line depicting the Ladd-Yinger finding. Instead, the data points are scattered all over the place. There’s no relationship whatsoever between poverty rates and police costs locally … and just a faint whiff (not statistically significant) of a relationship between poverty rates and fire/EMS cost per resident (not shown).
What Really Counts Locally
On a hunch, I ran a second set of analyses, culminating in the relationship between combined police and fire/EMS protection costs per resident and each city’s combined property tax base and sales tax base per resident (Chart 2). Once again, I excluded Berkeley, Glendale, and Florissant (no fire department) but included Des Peres with its almost-unique, cross-trained Public Safety Department.
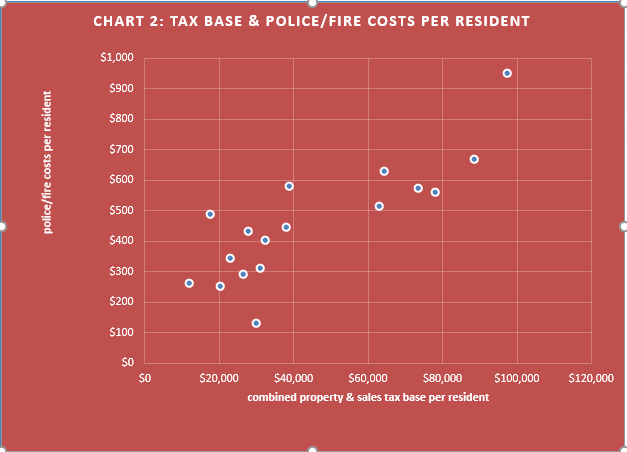
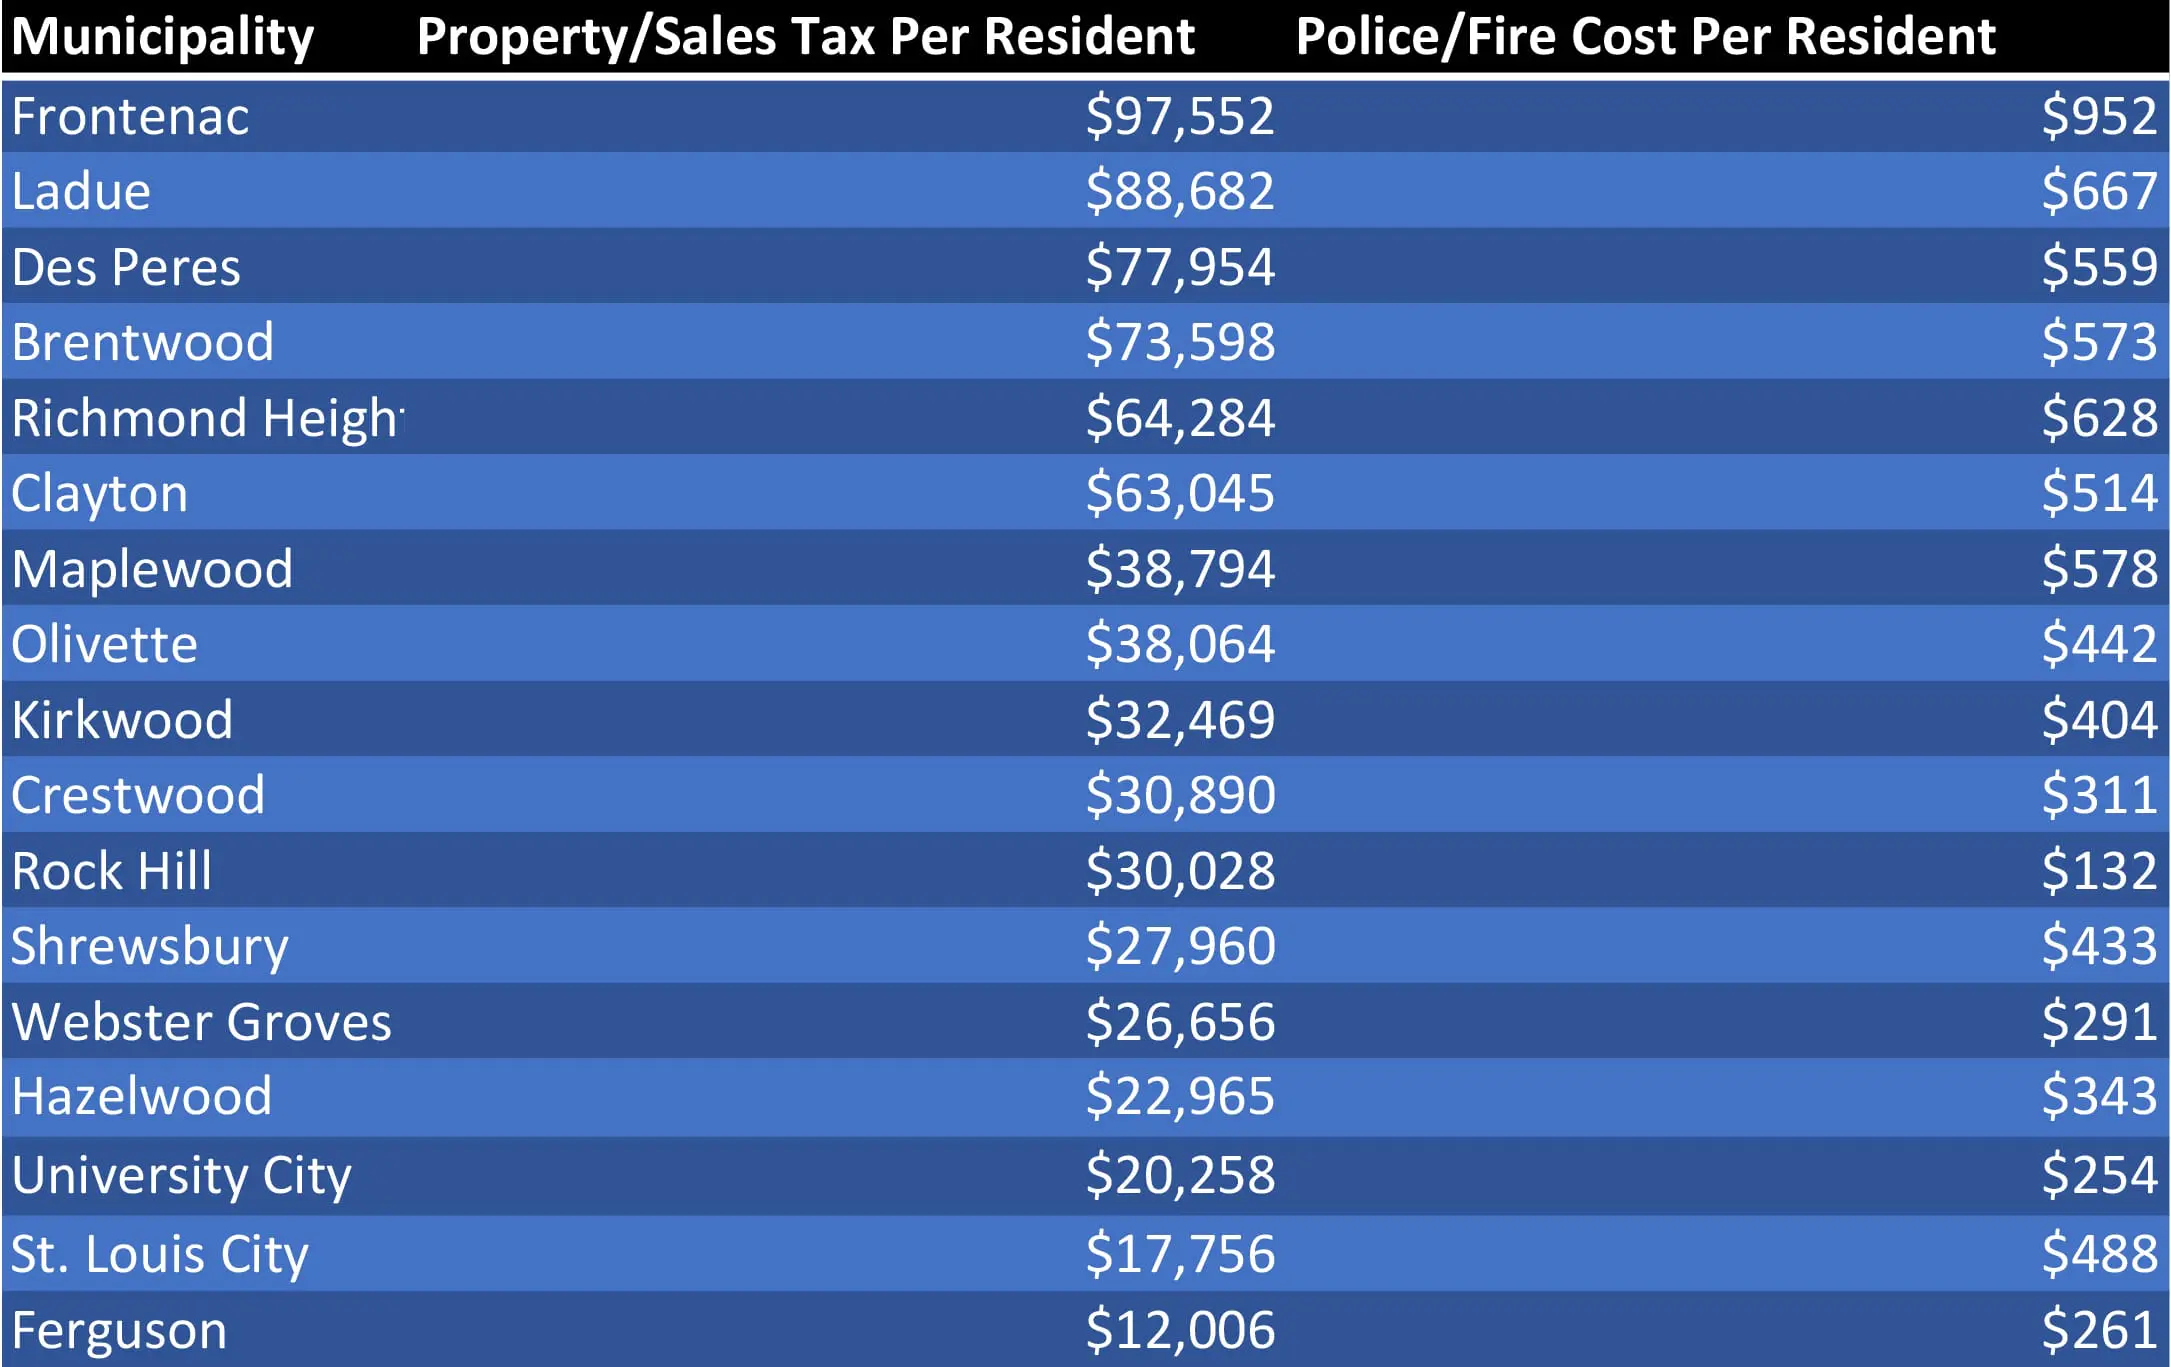
What a contrast with chart 1! The data points are clustered pretty tightly around the line (a least-squares regression line). And the correlation is positive: the cities with the highest property and sales tax bases per resident (Frontenac, Ladue, Des Peres, Brentwood, Richmond Heights, Clayton) spend the most on police and fire/EMS protection per resident; and the cities with the lowest tax bases (Ferguson, University City, Hazelwood, Webster Groves, Shrewsbury) spend among the least.
St. Louis City itself stands out. It has the second lowest property and sales tax base per capita among these cities but the eighth highest spending per resident on police and fire services. I suspect that reflects other significant sources of revenue that the city has, such as the third highest use tax base per resident in my sample and its controversial earnings tax. These are not counted in this analysis.
Why such a disparity in findings between the Ladd-Yinger analysis of 86 central cities and my analysis of St. Louis City and these 17 smaller suburban cities? In Ladd-Yinger world the cities with the greatest need for police and fire protection were spending the most; in the world of St. Louis those with the biggest need are spending the least.
What’s happening? The Newarks and the Detroits may be very benighted cities but as relatively “Big Boxes” they still have greater access to resources than a “little box” Ferguson. In a word, “little boxism” promotes greater economic and fiscal disparities.
The maximum tax base disparity nationally among the 86 central cities was about 3:1. Within just this local sample the disparity between Ferguson (property and sales tax base of $12,006 per resident) and Frontenac ($97,552 per resident) is 6:1.
Thus, with the 86 central cities having relatively similar tax bases, a socio-economic factor like poverty rate has a greater impact on public safety spending levels. Within the “little boxes” St. Louis area, tax base disparities reign.
Broadening my focus and looking just at property tax base per resident for St. Louis City and 89 cities in St. Louis County (excluding the freakish Champ village), the disparity between the richest (Huntleigh: $126,811) and the poorest (Velda City/Velda Village Hills: $3.801) is 33:1.
In fact, there are 24 cities with less property tax base per resident than Ferguson, the poorest community in my sample.
Perhaps the bigger local challenge that must be addressed is not how to bail out St. Louis City (possibly ridding it of its earnings tax and international airport in the process?) but, rather, what is to be done about providing public services like policing and fire protection, both in the City and in the dozens of micro-cities in St. Louis County that may not be viable, sustainable communities.
Previous David Rusk Regionalism Drill Down White Papers in This Series
#1 St Louis City and St Louis County – The Fake Region
#2 The Incredible, Shrinking “Metropolitan City of St. Louis”
#3 Scenic Overlook: Beware the O’Hara Rule
#5 Better Together and Indianapolis: Comparing Fruit Salads

David Rusk is a former mayor of Albuquerque, New Mexico legislator, and federal official who has consulted on regional issues in over 130 metropolitan areas in the USA as well as in Canada, Germany, England, South Africa and The Netherlands
He is author of Cities without Suburbs (4th edition 2012), called “the bible of the regionalism movement,” and three other books.
Mr. Rusk began analyzing the Better Together report for ConstructForSTL as soon as it was issued. In this series of white papers he is drilling down into items ranging from savings from consolidation, to size and ranking of the “statistical city”, economic development, planning and zoning, bond ratings, taxation, political representation, and Metropolitan Council composition.